

While using Claude to inspect the layoff-event figures (companies.json) from aiexposure.org, I became interested in companies that had gone through multiple rounds of layoffs between 2022 and 2025.
How did they choose to attribute the reasons for each layoff event?
Is their total employee count drastically different today than it was in 2022?
According to the data, Intel led the list in total employees laid off between 2022 and 2025 at ~37k. Amazon and Microsoft were at #3 (~23k) and #4 (~22k).
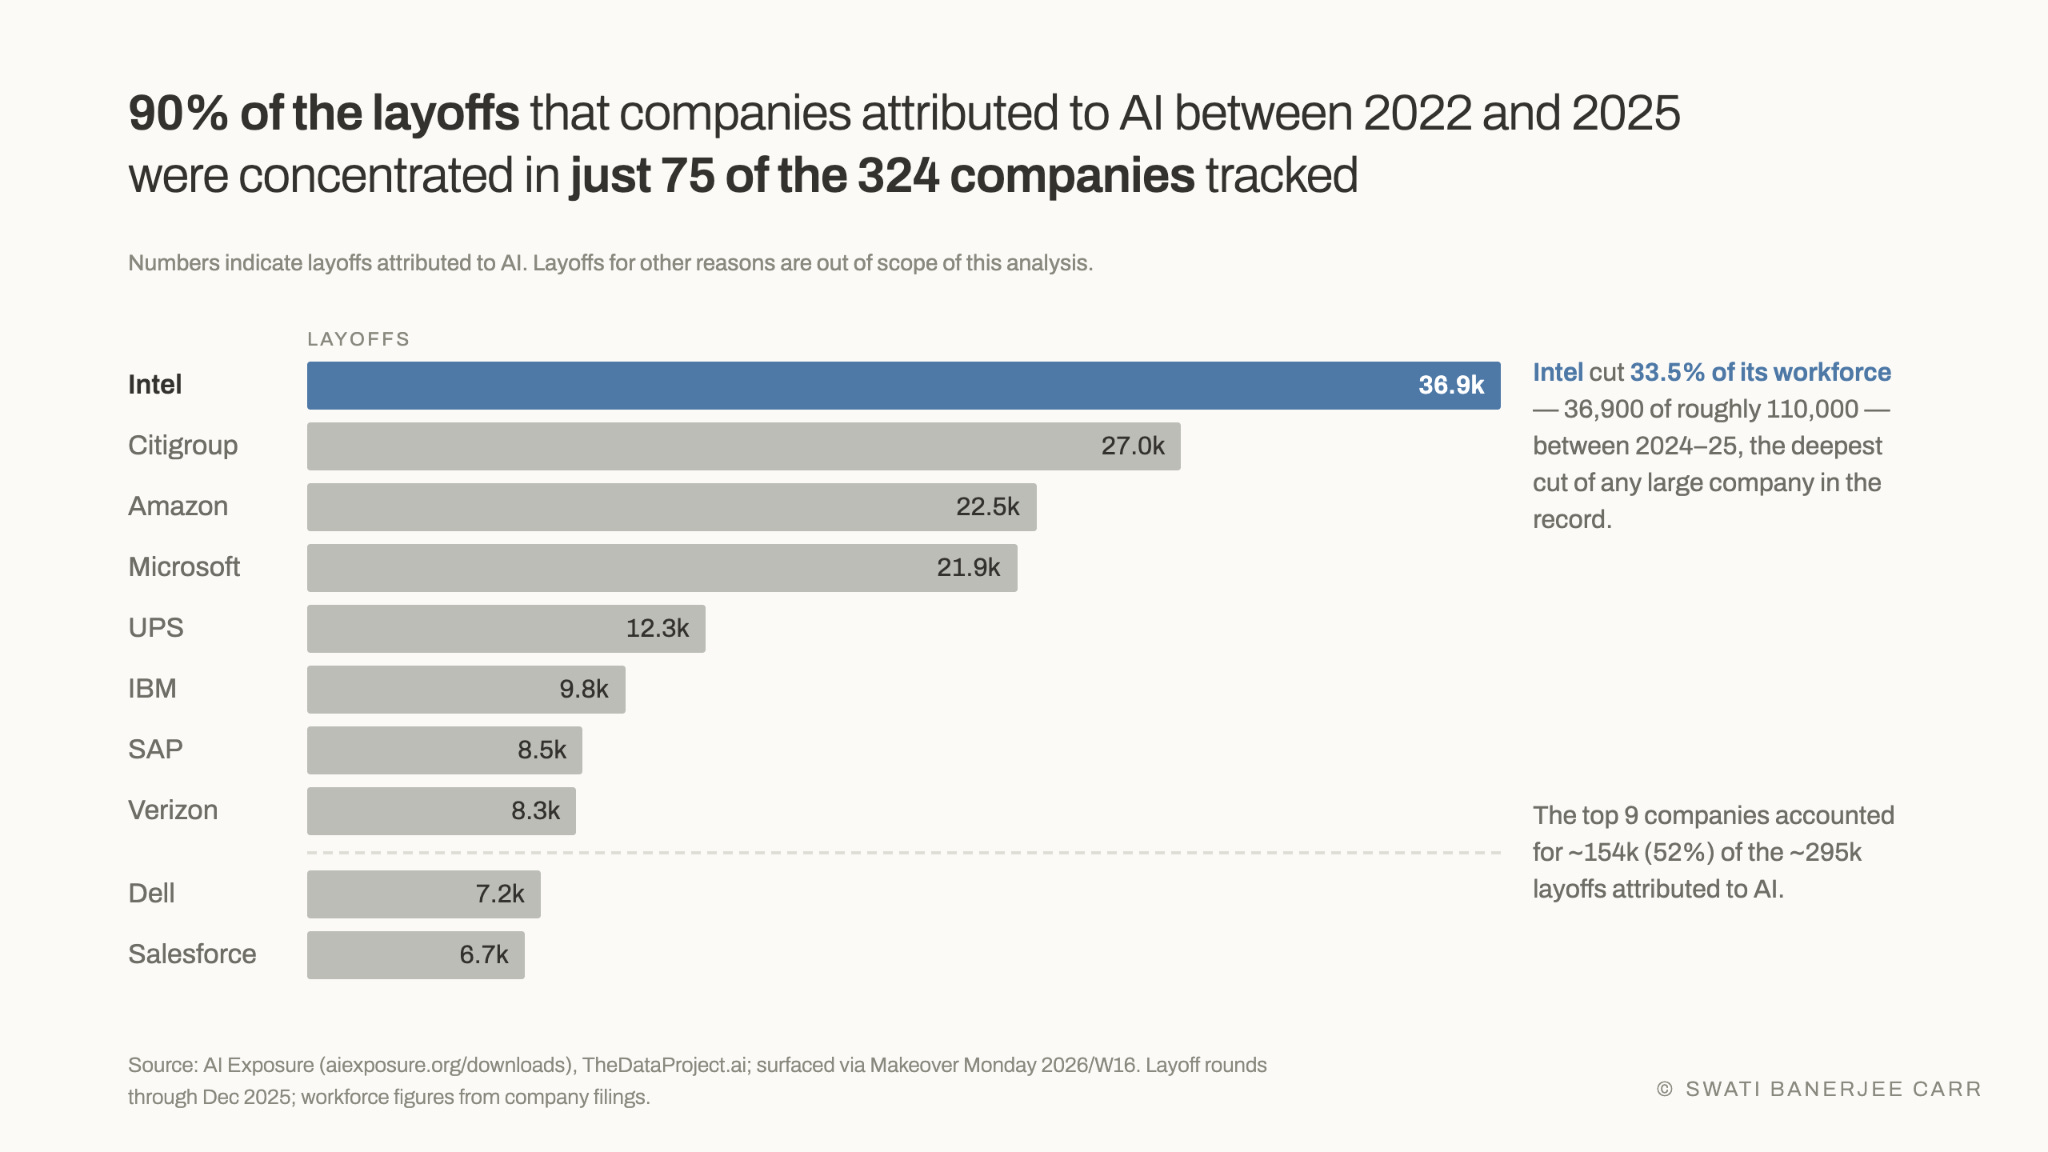
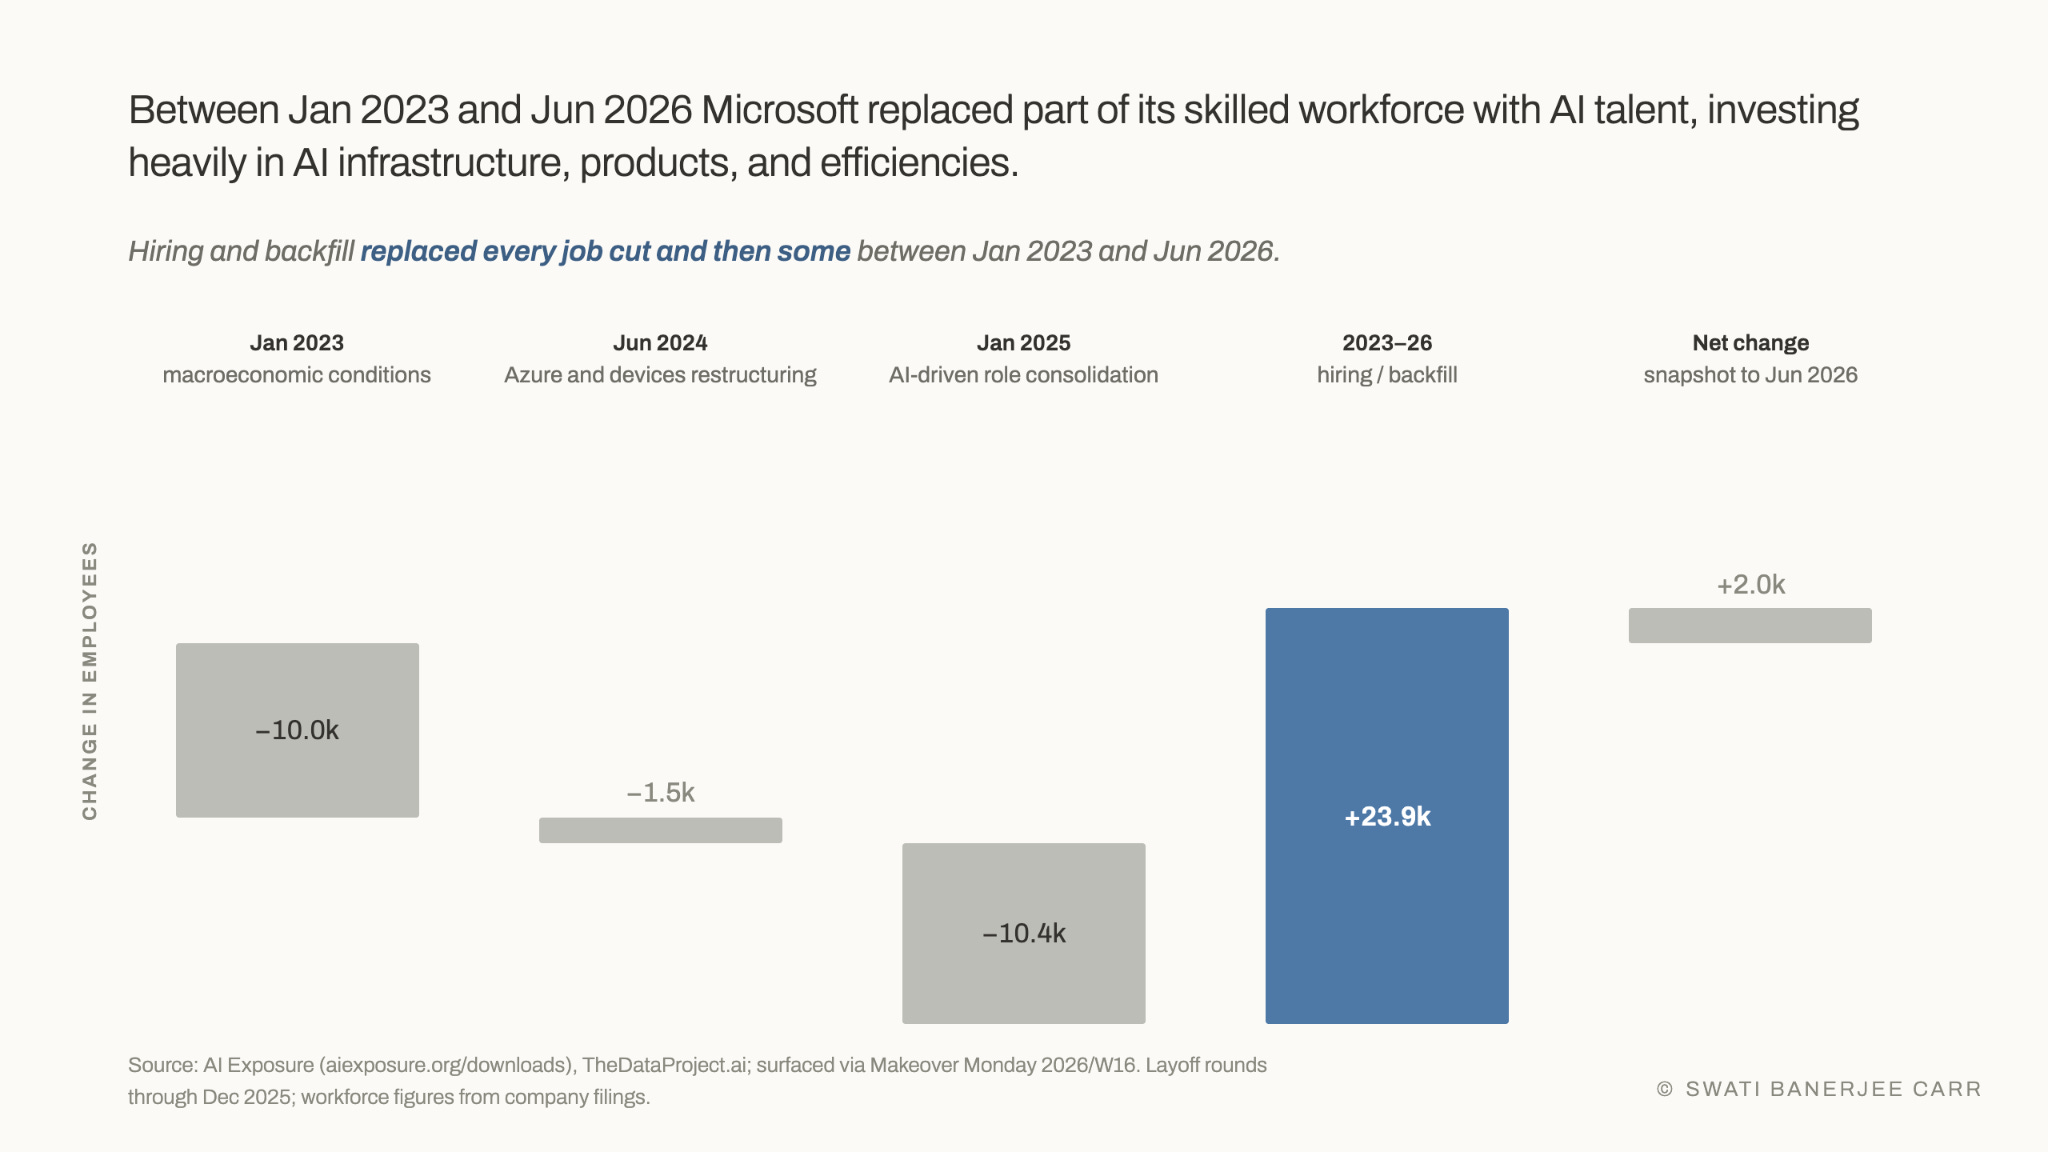
But what was interesting to me was that although Intel had ~25k fewer employees in 2025 compared to 2022, Microsoft had ~2k more employees than it had in January 2023. To me, this hinted that Intel experienced disruption that it didn’t successfully recover from whereas Microsoft and Amazon both successfully navigated course corrections in the face of a different technological landscape.
Of course, all this wasn’t in the data — only the layoff events, layoff month + year, and the company’s self-reported reasoning for layoff was in the dataset. And, in the case of Amazon, the data was clearly incomplete. There was no layoff data for the second half of 2025 but I knew from the news that there had been a very large, possibly its largest ever, round of layoffs in October and another smaller round of layoffs in early 2026.
There is a right way to ask Claude questions. Don’t ask: What are Amazon’s layoff numbers?
Instead, ask: What is a reliable way to get accurate layoff numbers for Amazon?. . .and then ask Claude to get them for you in the next question using the most sensible of the methods it suggests.
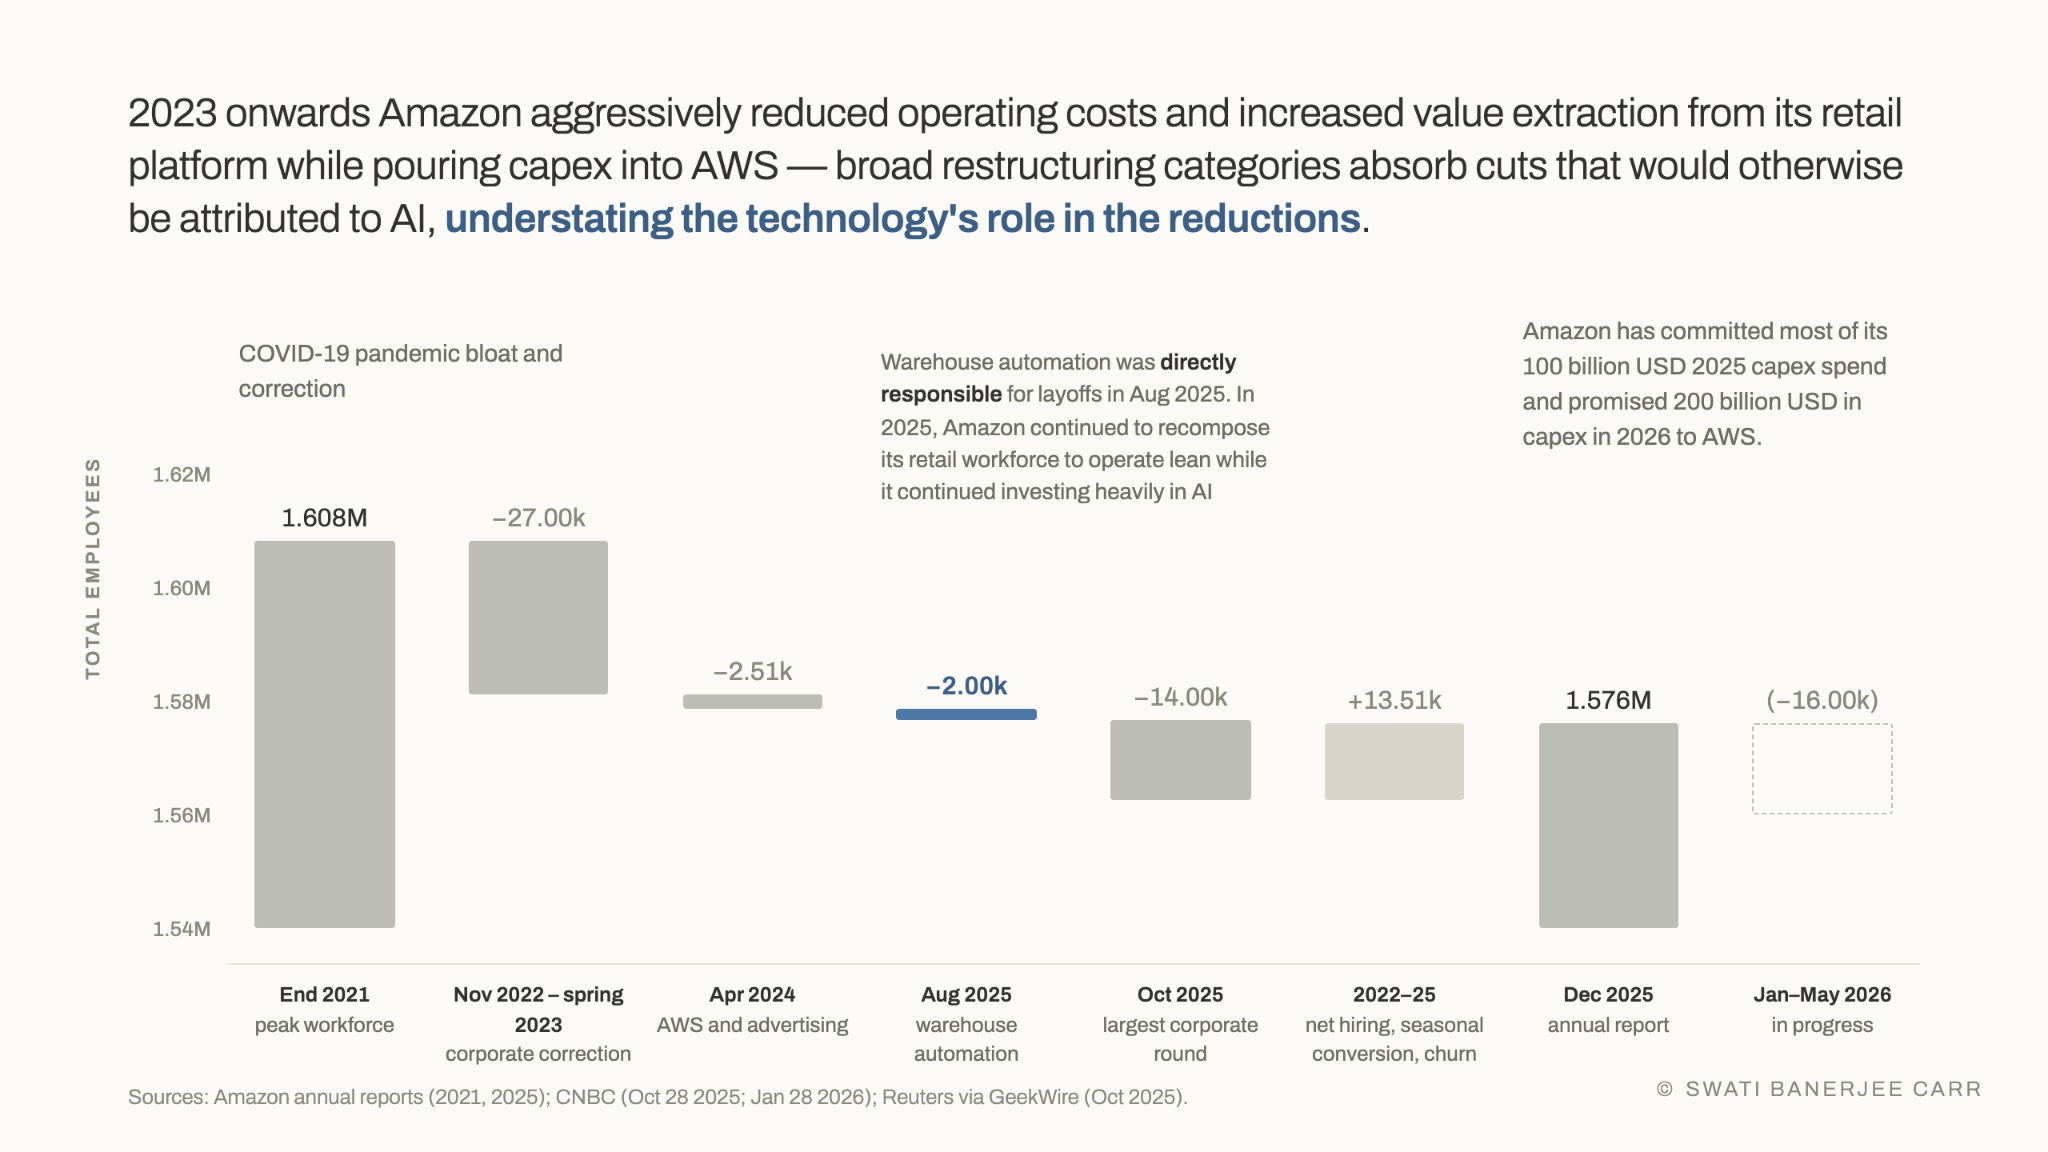
I asked Claude to look into the numbers by searching through Amazon’s annual reports and news coverage. What Claude found was that:
The 18k tranche of layoffs was really ~27k layoffs in stages between late 2022 and spring 2023
The dataset doesn’t record any layoffs after August 2025, entirely missing the October 2025 and January 2026 rounds
Its 1.54M workforce number didn’t carry a date
Counting those, Amazon’s real announced cuts were roughly double the 22,509 on record, and there’s no mention of how many people Amazon hired, which is the other half of the story.
This was the point where I had to decide.
Option 1: Chart what was there and add a footnote saying the data ends in August 2025.
Option 2: put the dataset aside and build my own.
This is where discernment comes into play: I decided here that the missing data was big enough to change the picture. If the dataset were only a little bit short, I’d have added a footnote to the chart. But the missing rounds were roughly the size of everything on record, so any chart I made from the dataset as given wouldn’t just be incomplete, it would be wrong. That made it an easy call.
It would have taken me weeks to compile a new dataset from primary sources and add domain context if not for Claude. It took Claude’s Fable 5 under 5 minutes to find and compile the data and another 3 minutes to chart it in Claude Design using my Storytelling with Data-inspired design system. (The Claude-generated chart titles and annotations were horrendous and took me much longer to get right — a topic for another day.)
Once again, I turned to Claude. I already expected the answer to be Amazon’s hard pivot to focus on Amazon Web Services (AWS) and make it the world’s largest hyperscaler — and I was right. The result of this data compilation and context collection was this waterfall chart.
Meanwhile, Microsoft underwent a similar investment into its Azure product, reinventing itself and emerging as one of the other top 3 hyperscalers and ending up with more employees than it had started with.
I asked Claude why a company that cut 37k people would still be 25k smaller three years later, when two others with similar cuts weren’t.
Intel’s entire business model was set up around an integrated device manufacturing process where it owns the factories that build all the chips it designs. This is a rigid process with volatile profit margins that is also capital intensive. When mobile and AI workloads pushed the market towards new chip architectures, Intel found it hard to follow. Pivoting would have meant writing off or retooling billions of dollars’ worth of CPU fabrication plants it already owned. It lost its market lead to NVIDIA, which doesn’t own its own factories.
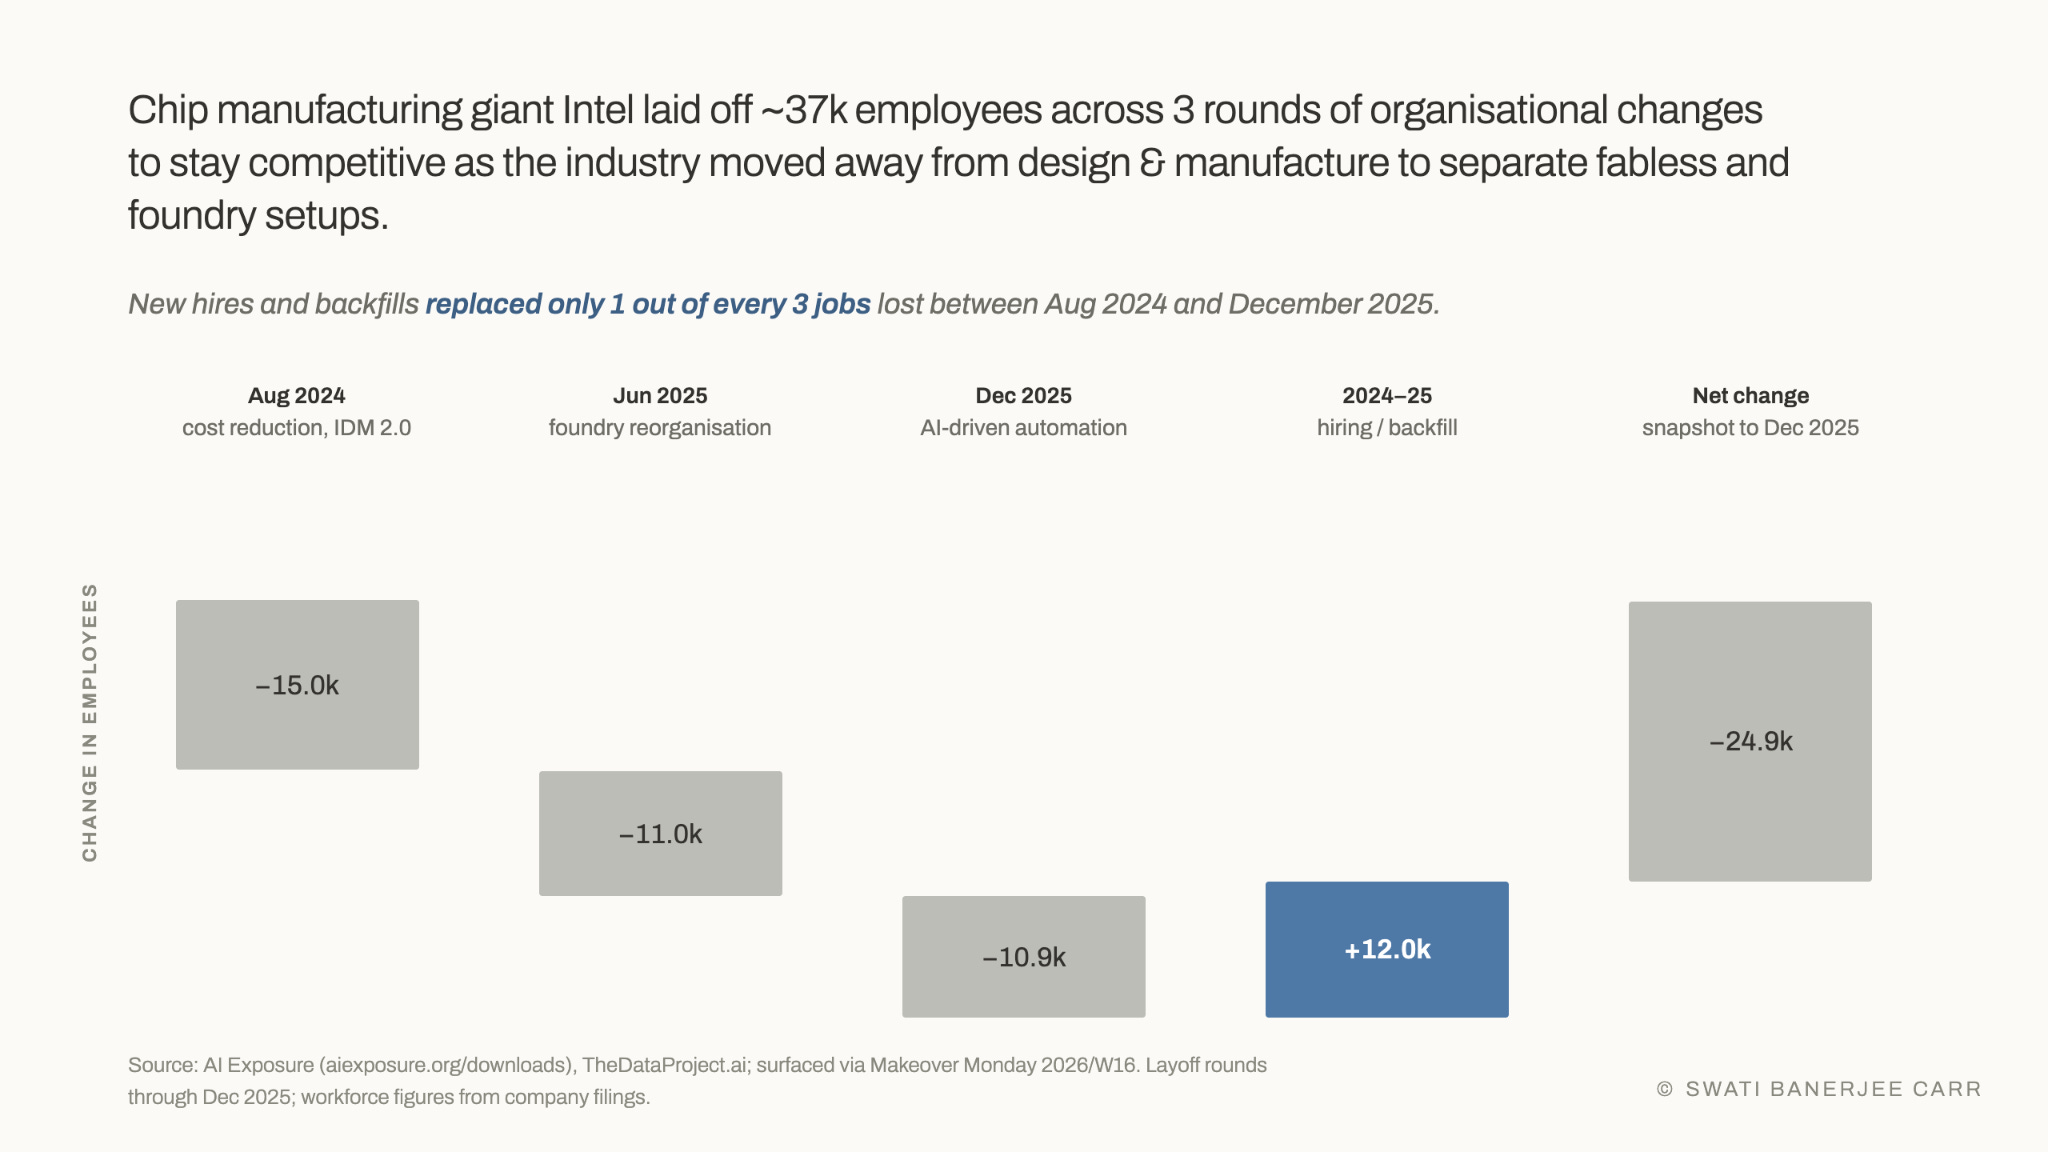
So Amazon, Microsoft, and Intel all cut jobs. My read of the data is that Amazon and Microsoft then hired a different kind of workforce for AWS and Azure, which the net figures hide, while Intel had no new business to hire for. The dataset can’t confirm that, since it doesn’t track hiring at all. But it’s the explanation that fits both the numbers and the industry context.
I didn’t know all this, and it certainly wasn’t in the dataset, but Claude enabled me to compile the information and match it to my dataset and construct this story in <60 minutes. How cool is that?!